How to calculate forward rates from the Treasury yield curve
Quick answer
To calculate forward rates from the Treasury yield curve, first bootstrap the published par yields into zero-coupon discount factors, then take the ratio of discount factors between the two dates: the forward rate from t1 to t2 is the rate that grows D(t2) back to D(t1). Do not plug par yields straight into the forward formula. On the 6 October 2026 curve that shortcut puts the 5-year rate five years forward at 5.51% instead of 5.59%, about 8 basis points too low.
A forward rate is the interest rate for a future period that the yield curve already locks in today. You get it from two points on the curve: the rate from now to t2, and the rate from now to t1, with the forward covering the gap between them. The catch with Treasury data is that the published curve is a par yield curve, and the forward formula needs zero-coupon rates. Skip that conversion and your forwards come out wrong by several basis points.
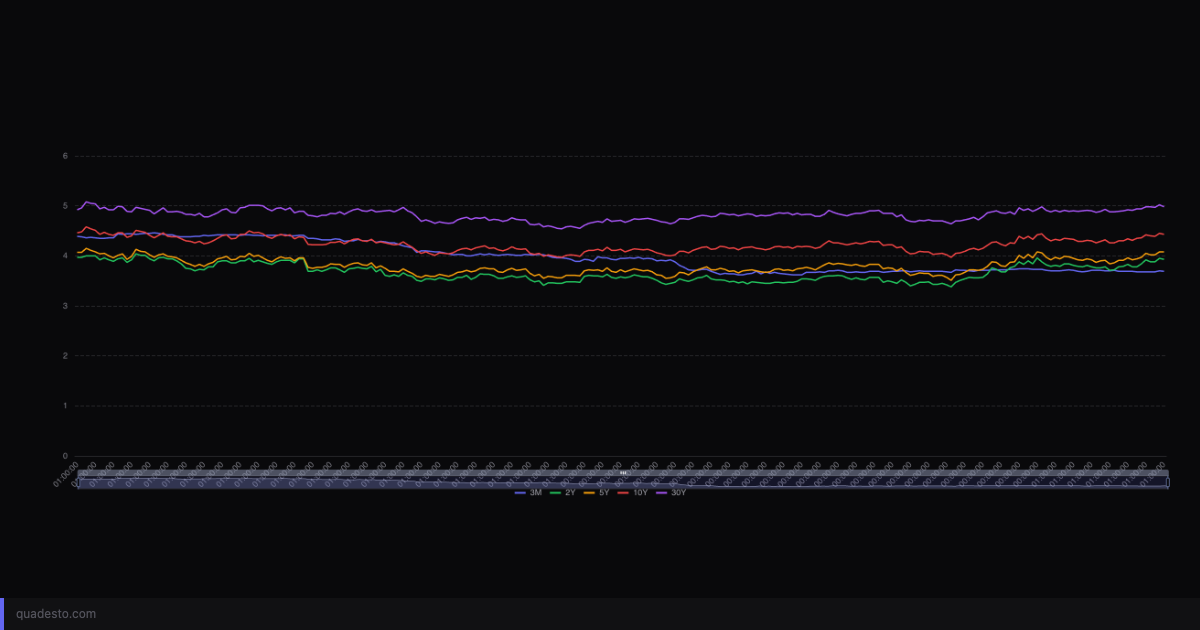
Below is the Treasury curve, live. The numbers in this post are computed from the 6 October 2026 row of the Treasury's own daily file, so the chart will have moved on by the time you read this.
The formula, and the input it needs
With zero-coupon rates compounded continuously, the forward rate between t1 and t2 years is (r2 × t2 minus r1 × t1) divided by (t2 minus t1). With discrete compounding it is the growth ratio between the two dates: ((1 + r2)^t2 divided by (1 + r1)^t1) raised to 1/(t2 minus t1), minus 1. Treasury notes and bonds pay coupons every six months, so the natural unit is half-years: work in discount factors, and the semiannual forward from t1 to t2 is 2 × ((D(t1) / D(t2))^(1 / (2 × (t2 minus t1))) minus 1).
Both r1 and r2 must be zero-coupon rates: the yield on a single payment at that date. That is what the discount factors D(t) encode. A par yield is something else, the coupon rate at which a bond of that maturity prices at 100, and it blends the rates for every coupon date along the way. The Treasury says so plainly in its methodology note: the official curve is a par yield curve. Our free Treasury data guide covers where the file lives and its quirks; this post is what to do with it next.
Step 1: bootstrap par yields into discount factors
Treat each par yield as a bond priced at 100 that pays half its yield every six months. At six months there is only one cash flow, so its discount factor falls straight out. At one year there are two, and the first is already discounted with the six-month factor, so you solve for the second. Keep going out the curve and each new maturity has exactly one unknown. This is the same bootstrap the Z-spread walkthrough uses, run for a different purpose.
The Treasury publishes par yields only at fixed tenors, so the half-year points between them need interpolating. The code below draws straight lines between the published par yields. That is a shortcut and we label it as one: the Treasury's own curve uses a monotone convex method on forward rates, and you will see below why that matters for forwards in particular.
Step 2: the 6 October 2026 curve, worked
The Treasury's daily par curve for 6 October 2026: 6-month 4.28%, 1-year 4.46%, 2-year 4.79%, 3-year 4.88%, 5-year 5.03%, 7-year 5.15%, 10-year 5.27%.
Bootstrapped, the 5-year zero rate is 5.050% and the 10-year zero rate is 5.320%, both semiannual. The zeros sit above the par yields because the curve slopes upward: a par bond collects part of its value through coupons paid at the lower, earlier rates, so its yield understates the rate on the final payment.
The 5-year rate five years forward, the 5y5y, from the zeros is 5.59%. Plug the par yields into the same formula instead and you get 5.51%. The shortcut is 8 basis points low, on a calm day, from nothing more than using the wrong input. The steeper the curve, the bigger that gap gets.
The 5y5y is the same construction that turns 5-year and 10-year breakevens into the 5y5y inflation forward, except that here it is applied to nominal rates.
The code
Pure Python, no packages, run against the live Treasury file on 7 October 2026. It reads the newest row, bootstraps the semiannual discount factors to 10 years, and prints the zeros, the 5y5y and a strip of 1-year forwards.
import csv, io, urllib.request

URL = ("https://home.treasury.gov/resource-center/data-chart-center/interest-rates/"
       "daily-treasury-rates.csv/2026/all?type=daily_treasury_yield_curve"
       "&field_tdr_date_value=2026&page&_format=csv")
req = urllib.request.Request(URL, headers={"User-Agent": "Mozilla/5.0"})
text = urllib.request.urlopen(req).read().decode()
row = next(csv.DictReader(io.StringIO(text)))   # newest date is the first row

tenors = [("6 Mo", 0.5), ("1 Yr", 1), ("2 Yr", 2), ("3 Yr", 3),
          ("5 Yr", 5), ("7 Yr", 7), ("10 Yr", 10)]
pts = [(t, float(row[col]) / 100) for col, t in tenors]

def interp(t):                                   # linear in par yield: a labelled shortcut
    for (t0, y0), (t1, y1) in zip(pts, pts[1:]):
        if t0 <= t <= t1:
            return y0 + (y1 - y0) * (t - t0) / (t1 - t0)

grid = [k / 2 for k in range(1, 21)]             # 0.5, 1.0, ... 10.0 years
df = []                                          # semiannual discount factors
for t in grid:
    c = 100 * interp(t) / 2                      # par bond: price 100, coupon = par yield
    df.append((100 - c * sum(df)) / (100 + c))

D = dict(zip(grid, df))
zero = lambda t: 2 * (D[t] ** (-1 / (2 * t)) - 1)
fwd = lambda t1, t2: 2 * ((D[t1] / D[t2]) ** (1 / (2 * (t2 - t1))) - 1)

print(row["Date"])
print(f"5y zero {zero(5):.4%}   10y zero {zero(10):.4%}")
print(f"5y5y forward {fwd(5, 10):.4%}")
for n in range(1, 10):
    print(f"1y rate starting in {n}y: {fwd(n, n + 1):.3%}")
Step 3: chart the forward strip, and know what the wiggles are
The script's 1-year forward strip on 6 October 2026, the 1-year rate starting in 1 through 9 years: 5.14%, 5.08%, 5.21%, 5.37%, 5.44%, 5.59%, 5.54%, 5.64%, 5.75%.
Two of those steps go down: the rate starting in 2 years is below the one starting in 1, and the rate starting in 7 is below the one starting in 6. Do not read those as a market view. Straight lines between par yields put a kink at every published tenor, and forwards, being differences of the curve, turn each kink into a jump. A forward curve built this way is a sawtooth by construction, which is exactly why the Treasury interpolates forward rates with a monotone convex method instead. If you publish a forward strip, either use a smooth method or show only forwards between published tenors, such as 2y-to-5y and 5y-to-10y, and say which you did.
On the chart itself, put the par curve, the zero curve and the forward strip on one axis against maturity. The ordering tells the story: on an upward-sloping curve the forwards lie above the zeros and the zeros above the par yields, and an inverted curve reverses it, as the inversion post shows for the spread view.
[QUADESTO-EMBED: 6 Oct 2026 Treasury par curve, bootstrapped zero curve and 1-year forward strip on one maturity axis, interpolation method named in the caption]
What a forward rate is not
A forward rate is the rate that makes the curve consistent: borrowing for 10 years and borrowing for 5 then rolling at the 5y5y cost the same. It is not a forecast of where the 5-year yield will be in 2031. Forwards also carry whatever extra yield investors demand for holding longer bonds, so a forward can sit well away from where rates actually end up. Label the line "forward", not "expected".
Where Quadesto fits
Everything here starts from the Treasury's free daily file. Quadesto charts that curve live, like the embed at the top of this post, and the yield curve tool is the quickest place to see it updating day by day. Whatever you build, put the curve date, the interpolation and the compounding convention in the caption, because each one moves a forward rate by more than a basis point.