How to Embed a KPI Dashboard in Webflow
Quick answer
To embed a KPI dashboard in Webflow, build the dashboard in Quadesto, copy its embed snippet, and paste it into a Webflow Embed element where you want it to appear. The dashboard stays live, so updating the data in Quadesto updates Webflow without republishing.
Webflow is great at design and weak at live data. If you've ever tried to show a KPI dashboard or a data table on a Webflow site, you've hit the wall: static screenshots go stale, and native charting doesn't exist. The fix is to build the dashboard once in Quadesto and embed it. This guide walks through it step by step—setup, the embed snippet, customisation, and the questions people ask.
What you'll need
A Webflow site you can edit, a Quadesto account, and the data you want to show—a KPI summary, a metrics table, or a chart. That's it. No plugins, no custom code beyond a single embed.
Step 1: Build the dashboard in Quadesto
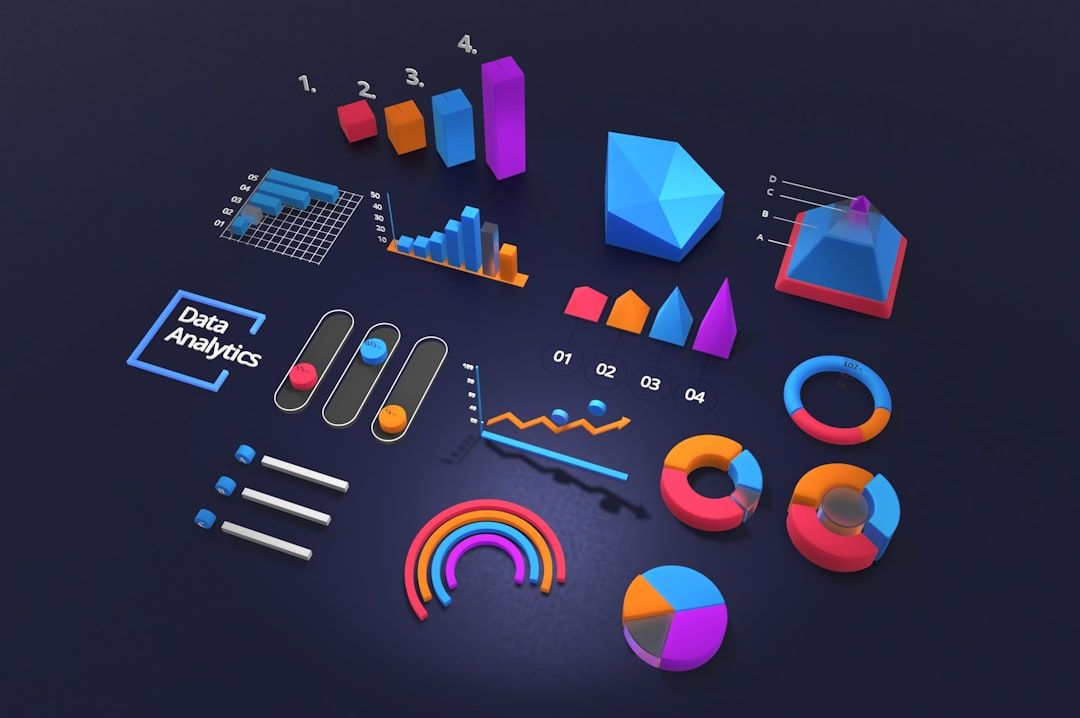
Connect your data source or paste your figures, then choose the view: a KPI tile row, a sortable data table, or a chart. Quadesto is finance-aware, so numbers, dates, and currencies format correctly without manual fiddling. Get it looking publication-ready before you embed—what you see here is what your visitors see.
Step 2: Copy the embed snippet
Open the embed panel and copy the snippet. It's a small block of HTML—an iframe or script tag—that points to your live dashboard. Copy the whole thing.
Step 3: Paste it into Webflow
In the Webflow Designer, drag an Embed element (Add panel, then Components, then Embed) onto the page where you want the dashboard. Paste the Quadesto snippet into the code box and save. Webflow renders a preview inside the canvas so you can position it like any other element.
Sizing and layout
Wrap the Embed in a div block and set the width to 100% so the dashboard is responsive. Give it a sensible min-height so it doesn't collapse before the content loads. Test on mobile—data tables benefit from horizontal scroll on small screens.
Step 4: Publish
Publish the Webflow site as usual. The dashboard is live. Because it's an embed, the data stays connected to Quadesto—update your figures there and the embedded view updates too, with no need to republish Webflow.
Customising the look
Match the dashboard to your brand: set colours, fonts, and number formats in Quadesto so the embed feels native to the page rather than bolted on. Keep the surrounding Webflow section clean—let the data be the focus. A single, well-formatted table beats three competing charts.
Why embed instead of screenshot?
A screenshot is out of date the moment you take it. An embed is always current, interactive, and accessible—visitors can sort, hover, and read real values instead of squinting at a blurry image. For anything that changes—KPIs, pricing, performance—live beats static every time.
New to embedding in Webflow? Start with our walkthrough on embedding a chart in Webflow, then come back for the full dashboard.
Troubleshooting
The embed doesn't show
Check that you pasted the full snippet and that the Embed element isn't hidden by an overflow setting on a parent container. Publish the site—embeds often don't render in the Designer preview but work on the live URL.
It looks cramped on mobile
Set the wrapper to 100% width and allow horizontal scroll on tables. Avoid fixed pixel widths.
Frequently asked questions
Can I embed a KPI dashboard in Webflow without code?
Yes. You paste one snippet into Webflow's Embed element—no custom development. Quadesto generates the snippet for you.
Will the data stay up to date?
Yes. The embed points to your live Quadesto dashboard, so updates appear automatically without republishing Webflow.
Does this work for tables as well as charts?
It does. Quadesto handles KPI tiles, sortable tables, and charts—embed whichever fits the page.
Stop screenshotting spreadsheets. Build the dashboard once in Quadesto, embed it in Webflow, and let it stay live.
When a live dashboard beats a static report
Static reports answer yesterday's question. A live KPI dashboard answers today's. If your metrics move—revenue, signups, performance, pipeline—an embedded dashboard means your Webflow page is never out of date, and you never have to re-export a chart and re-upload it. You change the number once, at the source, and every page that embeds it updates.
Keep the numbers correct
Speed is only useful if the figures are right. Quadesto formats financial and business data with the correct conventions—thousands separators, currency symbols, percentages, and sensible date handling—so an embedded KPI table reads cleanly and means what it says. A dashboard that looks polished but rounds the wrong way is worse than a screenshot. Correctness first, then presentation.
That's the difference between a chart that decorates a page and a dashboard people actually trust enough to act on.
One source of truth
Because the embed points back to Quadesto, there's a single source of truth. No more reconciling a number on the website against a number in a spreadsheet against a number in a slide. Update Quadesto, and the website, the report, and the embed all agree.